Getting Started
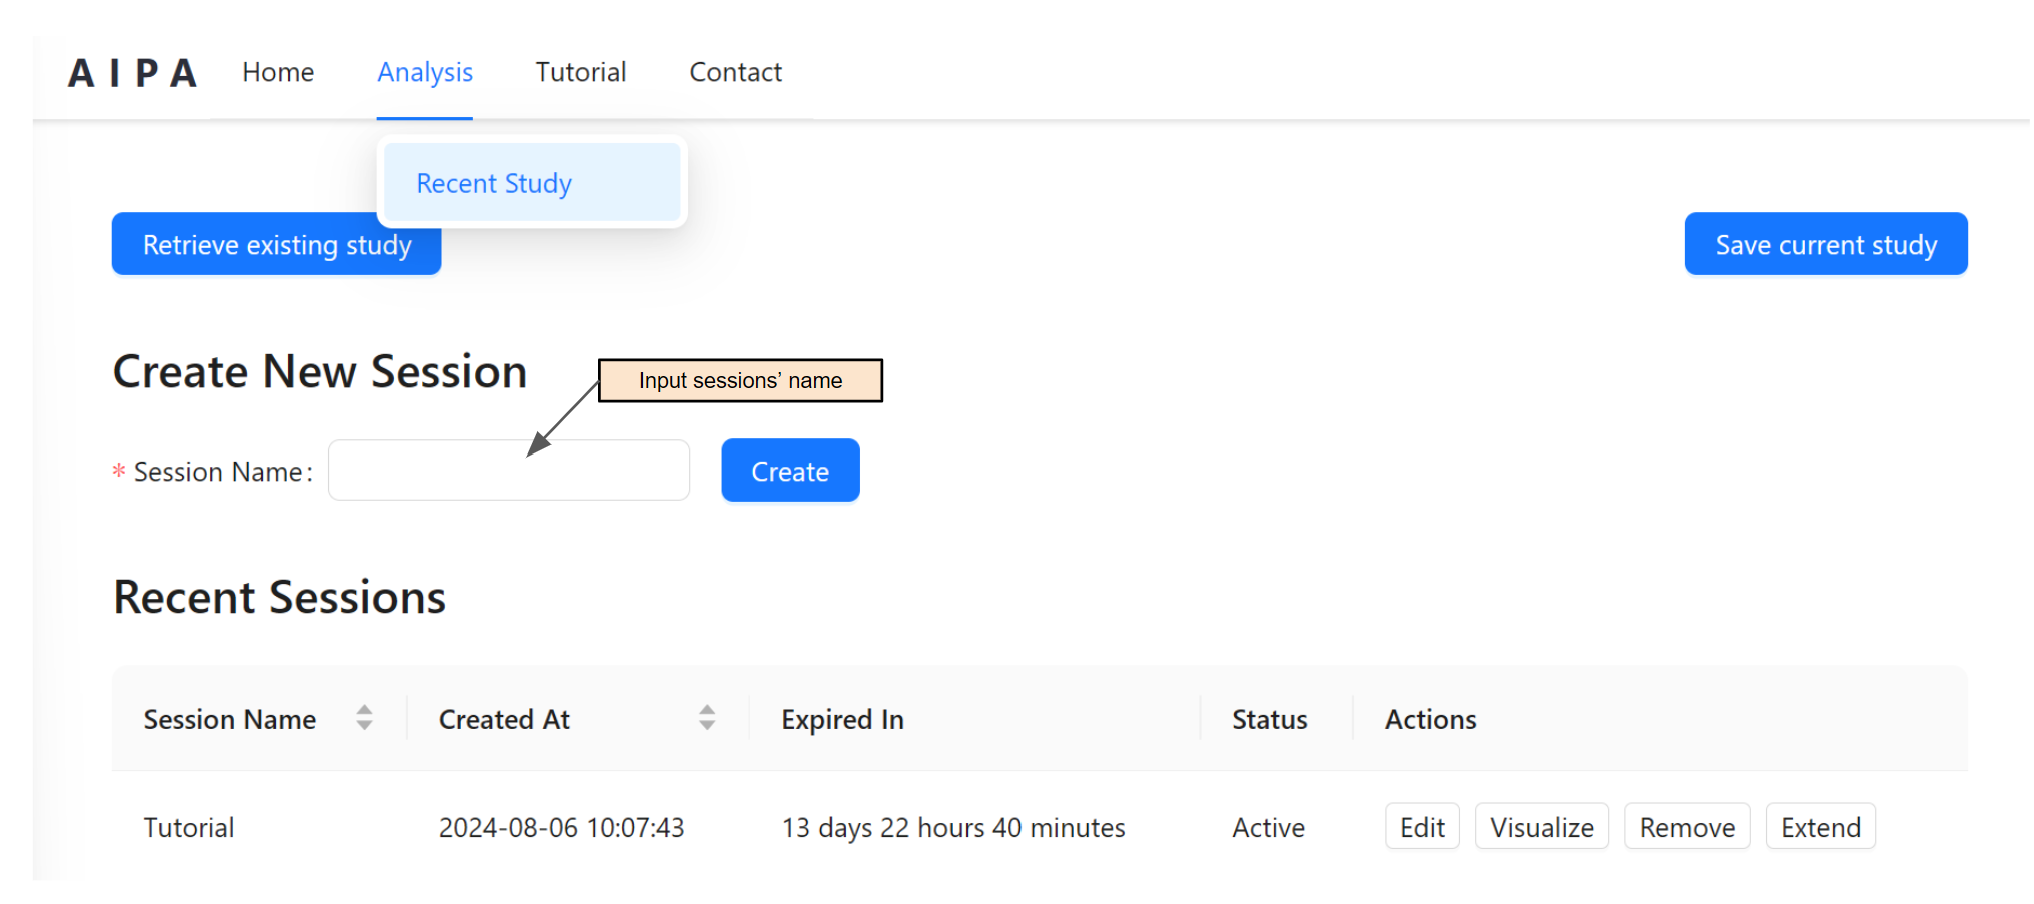
All analyses are performed on the Analysis page. To access the Analysis page, either click the "Begin Your Analysis" button on the homepage or select "Recent Study" under the "Analysis" menu.
To create a new session, input a session name and press "Create".

Once a session is created, users can edit the analysis' name (Step 1) and an input type for the analysis in Step 2. One session can analyze multiple data sets by adding multiple analyses (Step 3 & 4). This is especially helpful when users want to analyze multiple datasets at the same time for meta-analysis.

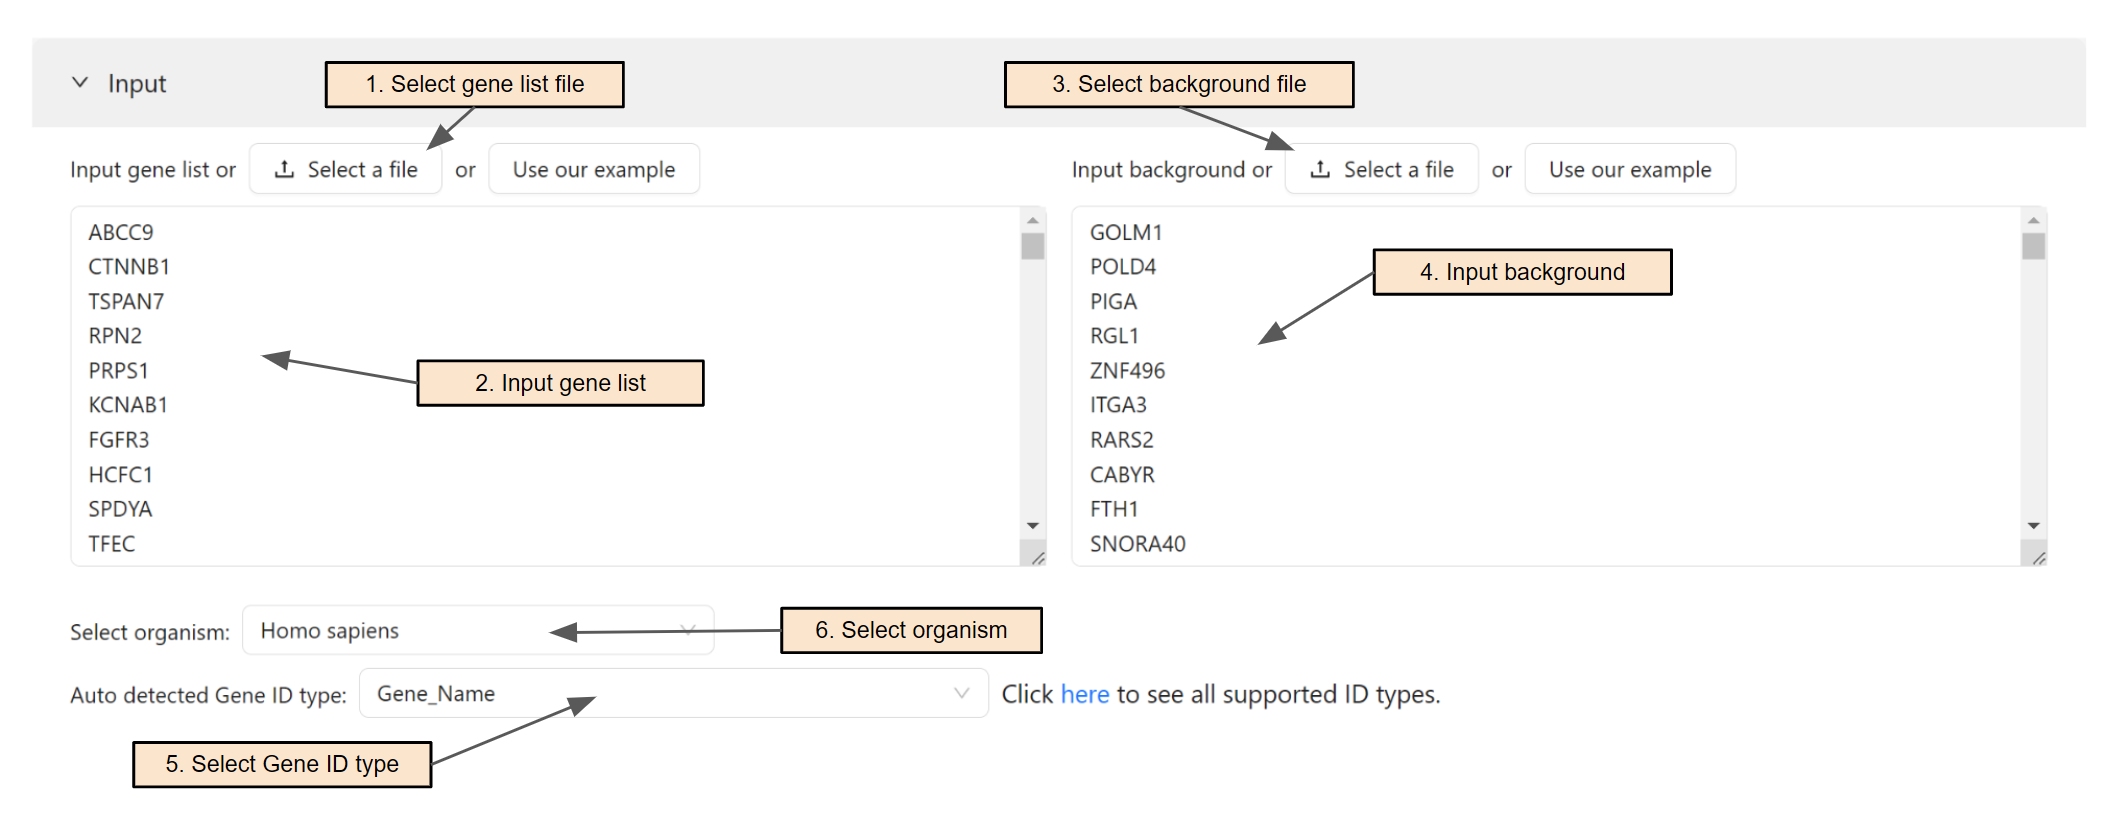
Users will select a gene list file (Step 1) or paste the gene list directly into the text area (Step 2). Users can also select a background file (Step 3) or paste the background directly into the text area (Step 4). If a file is selected, its content will be automatically parsed into the text area.
The system will automatically detect the input ID type. Users can change the ID type of the input in Step 5.
Users will then select the organism for the analysis. To search for an organism, simply enter text in the search box (Step 6).

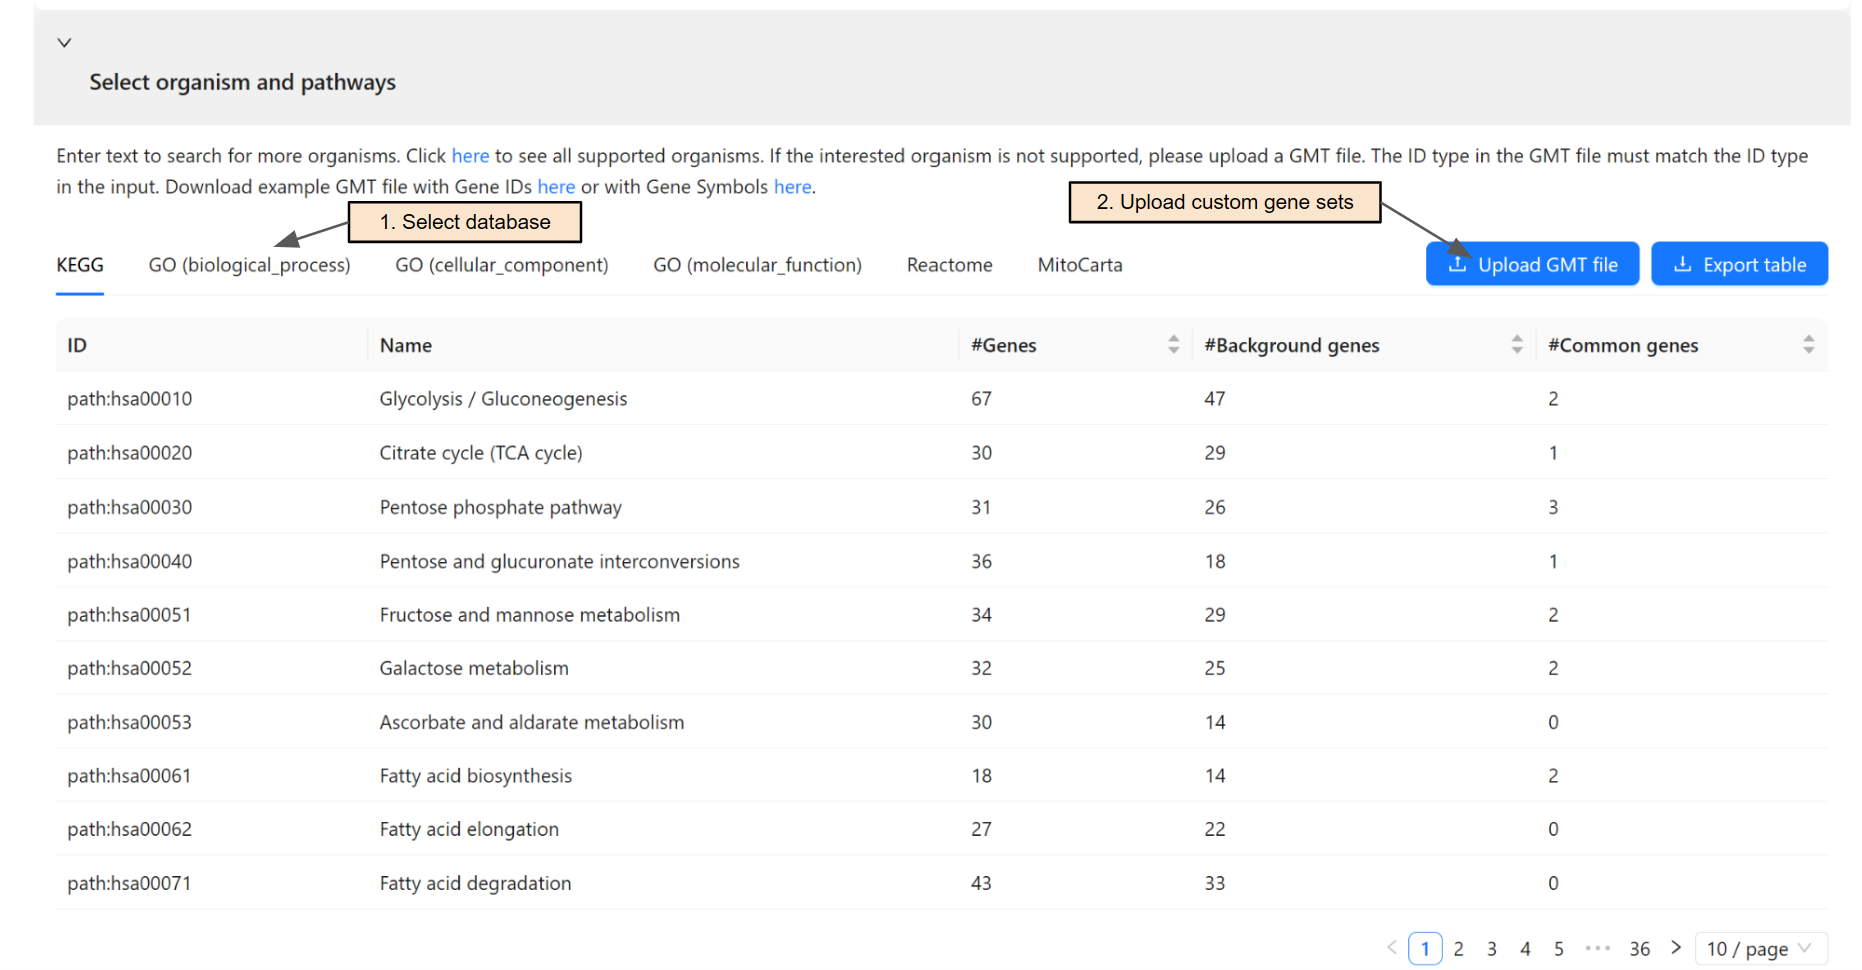
Once an organism is selected, the system will retrieve gene sets from KEGG database and Gene Ontology. Users can switch among databases using the corresponding tab (Step 1).
Users can upload a GMT file for custom gene sets (Step 2) if their database of interest is not supported. The ID type in the GMT file must match the ID type in the input.
Users will then press Start Analysis to start the analysis.

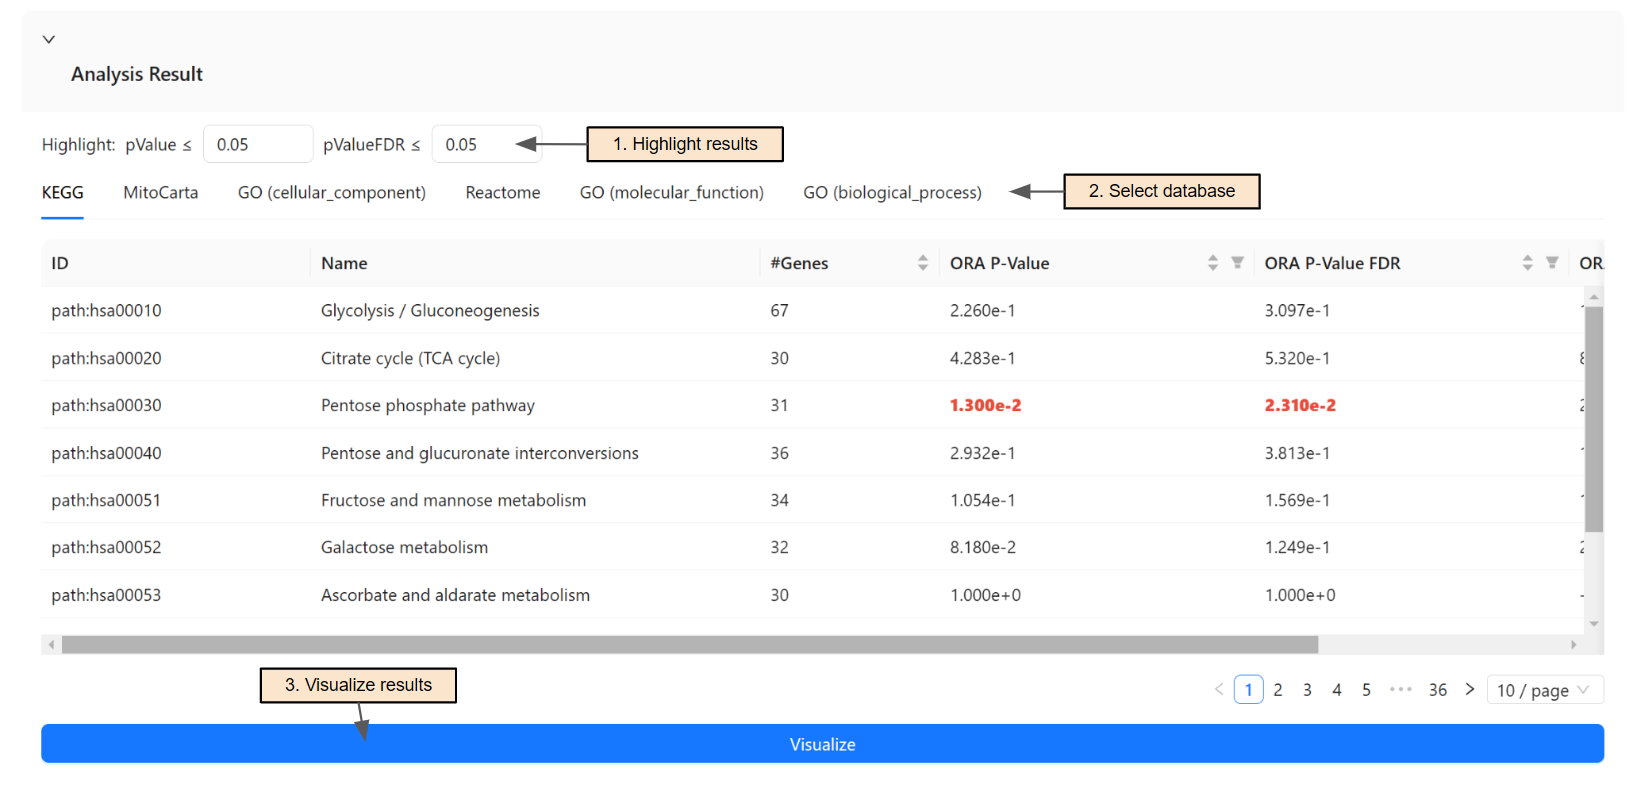
Once run, a table for previewing the analysis results will be shown.
The table shows the p-value and corrected p-value (e.g, P-value, P-Value FDR) of each pathway and gene set included in the analysis. The p-values will be color-coded based on their significance, using a threshold defined by users (Step 1).
Users can also select to see results of different databases (Step 2). Finally, users can visualize all the analysis results together (Step 3).
